Wave is imaginary and mysterious thing to us. Many of them are invisible and we even don’t know their presence, but they exist. The wave coming out from mobile, wave captured by television, FM waves, x-ray waves, etc are common example of waves we encounter in our daily life. Among these all, light, source of energy of our entire planet comes to earth in the form of wave. Waves are actually disturbance, some sort of vibration or oscillation travelling through space and time. Waves in most of the case contain some form of energy and they are responsible for transfer of energy. Technically, these waves are certain form of electric and magnetic fields. So these waves are commonly known as electromagnetic waves.
In the virtual world of electromagnetism, waves travel amazingly making different function with space and time. The best way to represent their travelling in forward backward direction with space and time is by using sine or cosine function and represent their decay with space and time is by using exponential function. These waves seem amazing when we actually see them travelling in space. I present here electromagnetic wave plotted in MATLAB.

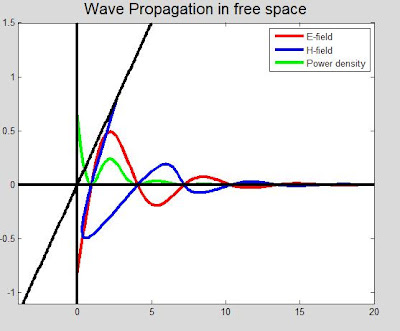
Figure1: Electromagnetic wave in free space
The plot above is a snapshot of traveling electromagnetic wave in free space. The wave is traveling forward along with horizontal black line. The vertical black line and the tilted black line acts as a reference point and considered to be the origin of the wave. Electrical field waves and magnetic field waves are shown in red and blue colors respectively. The power of the wave is actually power density or poynting vector, is shown in green color.
From the electromagnetic theory, electrical and magnetic fields can be expressed as function of space (z) and time (t) as:

Where, α = attenuation factor of wave.
ω = angular frequency of wave.
λ = wavelength of wave.
The power or the energy carried by these waves is power density (S) given as
S=E×H…………………………..(iii)
Inserting all these equations in MATLAB, my attempt is to make simple GUI which is shown below.

Figure 2: Electromagnetic wave visualization tool
It is electromagnetic wave visualization tool that I developed in MATLAB. It can plot electromagnetic wave in different parametric condition. “Choose medium” box has three options: ‘Free Space’, ‘Lossless medium’ and ‘Lossy medium’ that plays movie of the electromagnetic waves in those conditions. Similarly, I have made other boxes for different parametric change (You can explore them in GUI figure file). The snapshot of ‘Free space’ is shown in figure 1. Snapshot for other medium are shown in figure 3 and figure 4.

Figure 3: Electromagnetic wave in lossless medium

Figure 4: Electromagnetic wave in lossy medium
The electromagnetic wave is simulated in MATLAB is by using ‘movie’ command. This command snaps the different frames first and then plays them in figure window of MATLAB. A small piece of code may be useful to understand the working of plot of electromagnetic wave and ‘movie’ command.
framemax=20;
M=moviein(framemax);
for z=1:framemax
E = exp(-t.*a).*cos(w.*t-2*pi*z/framemax); % a = alpha, w = omega
H = exp(-t.*a).*cos(w.*t-2*pi*z/framemax+phi);
S = E.*H;
% plot command
M(z) = getframe(gcf);
end
movie(M)
I have used 20 frames for the simulation. For each frame, it snaps different space value (z) with different sets of time value (t).